Due to the many questions around "how's the market" that we all receive on a daily basis, we thought it may be best to offer some of our thoughts on what is happening in today's markets, and what we may see in markets ahead. In regards to market specifics, you will find a brief summary for each of the markets that we have an office in below the showing time report.
What is happening??
When looking at the market activity, and listening to the news reports, it's easy to throw our hands up in the air and say the markets are strange and we have no idea why they keep surging forward. We wanted to take a step back to try to understand why. With everything that has been going on in the world, what has changed. While there could be a variety of reasons for what is fueling the insurgency in sales, and we don't fully know how long it will last, here are a few thoughts to consider.
Savings are through the roof!!
To start, let's take a look at household saving. With less opportunities for consumer spending, there is a higher amount of saving that has been happening through the first half of 2020. According to Stats Canada, in the first quarter of 2020 Canadians saved 7.6% of their disposable income which is the highest level they have seen since 1996. This grew to 28.2% in the second quarter which was a huge spike, the highest savings rate since 1961! To put this into context, the average rate of saving over the past five years preceding Covid was 3%.
Deferrals, are they good or are they bad?
Another aspect to household savings is tied to the mortgage deferral program that was put in place. A very real concern was that the widespread income loss during the Pandemic would cause significant challenges for households that are highly indebted, and whether or not they would be able to keep up with their payments. While many have compared the pandemic to recessions in the past, the Bank of Canada has found that there are more similarities to a natural disaster that has immediate and severe impacts that are much shorter lived than a recession. According to the Bank of Canada, the households that are indebted can cope with temporary income losses and continue to make mortgage payments for a median of 9.6 months. While the median seems to be quite high, they found that one in five homes could make two months payments using liquid assets while one third of households could make four months payments using liquid assets. Keeping this in mind and taking a look at the projected results for the mortgage deferral program, they estimate to have pushed back the peak so mortgages that go into arrears by 6 months, as well as significantly lower that rate as well. The simulation they did to estimate this went from the potential peak of mortgages in arrears hitting in November at a rate of 1.3% (an all time high) if nothing was done, to the peak hitting in May 2021 at a rate of 0.53% as a result of the mortgage deferrals.
Mortgages in Arrears are at what rate??
This brings us to the discussion of what
Mortgages in arrears typically looks like in Canada, and Alberta. The definition of arrears is three months without payments which would then lead to foreclosure proceedings. The Candadian Bankers Association has tracked these numbers through the decades, and as of April 2020, the percentage of mortgages in arrears in Canada was at 0.25%, and in Alberta was at 0.52%. If we look at Alberta specifically, these numbers have been rising since September of 2015 when it was at 0.27%. The mortgages in arrears in Alberta has never exceeded 1%, which was in the early '80's. This suggests to us that through recessions and hard times, the banking institutions prefer to work with people to help them keep their homes. The deferral program should contribute to keeping these numbers low.
Is the Bank of Canada just printing money??
Next it is important to understand why interest rates are at a new all time low. In order to keep the financial system working well, our households and businesses have access to credit as our economy relies on credit. Here is a great resource that explains how the Bank of Canada has bought Canada Mortgage Bonds, commercial paper, bankers’ acceptances, corporate bonds, and federal and provincial government debt to help keep credit available for Canadian companies and households. They are using what is called settlement balances to purchase these, which act like loans from financial institutions to the Bank of Canada with an interest rate of 0.25%. As a result of these purchases, the financial markets can function properly to work with the Bank of Canada's record low interest rates to encourage spending and investment. This also will help companies borrow so they can invest in hiring or expanding business. All of this has also led to the record low mortgage rates which is helping fuel the Real Estate market.
Rentals on fire!
Another piece to this puzzle is the Rental market, and how that has become much more competitive in Alberta. For these numbers we will use the largest market in Calgary to give us an overview of what is happening. To look at other cities, feel free to use
Rentfaster.ca for their stats. At the beginning of 2020, the average days on market for a rental was at 88 days, that has now dropped to 43 days which was 74 days at this time last year. The inventory has also been dropping, making it more difficult for renters to find properties.
There's no place like home!
It is also important to consider what appears to be a renewed appreciation for our homes. With the uncertainty in the world today, and people being forced to take a step out of our "busy" lives it has brought about a new appreciation for family time at home. This has also led to people making decisions about where they live and if it suits their needs. The opportunity for many to work from home has also opened up new opportunities for people to live outside of the larger City Centers. The uncertainty has also led people to assess their financial situation, and in some cases has forced people to "right size" their homes due to their own situations.
Movin' on up...
All of this has contributed to the property ladder taking full effect. With the rental markets tightening, the savings increasing, the interest rates being rock bottom, and the importance of home increasing, it has led first time buyers into the market. One of the biggest challenges in recent markets has been that most buyers in the markets also had a home to sell in order to be able to make a move up. With the first time buyers market moving, this has allowed for movement in other areas of the markets as well.
Movin' on out...
The final piece to this is the people that have chosen to move out of Province as our Net Migration has been declining, and as of the end of the second quarter was down 1,836 across the Province.
Weathering the storm
With all of that said, this can all change on a dime as anything can and has happened in Real Estate. With so much uncertainty all we can do is look at the facts in front of us and adapt and adjust as we move forward. One of the biggest factors to watch that will determine how quickly we fully recover is going to be the labour market. With unemployment improving each month as people get back to work, this will be a key indicator for us to watch closely.
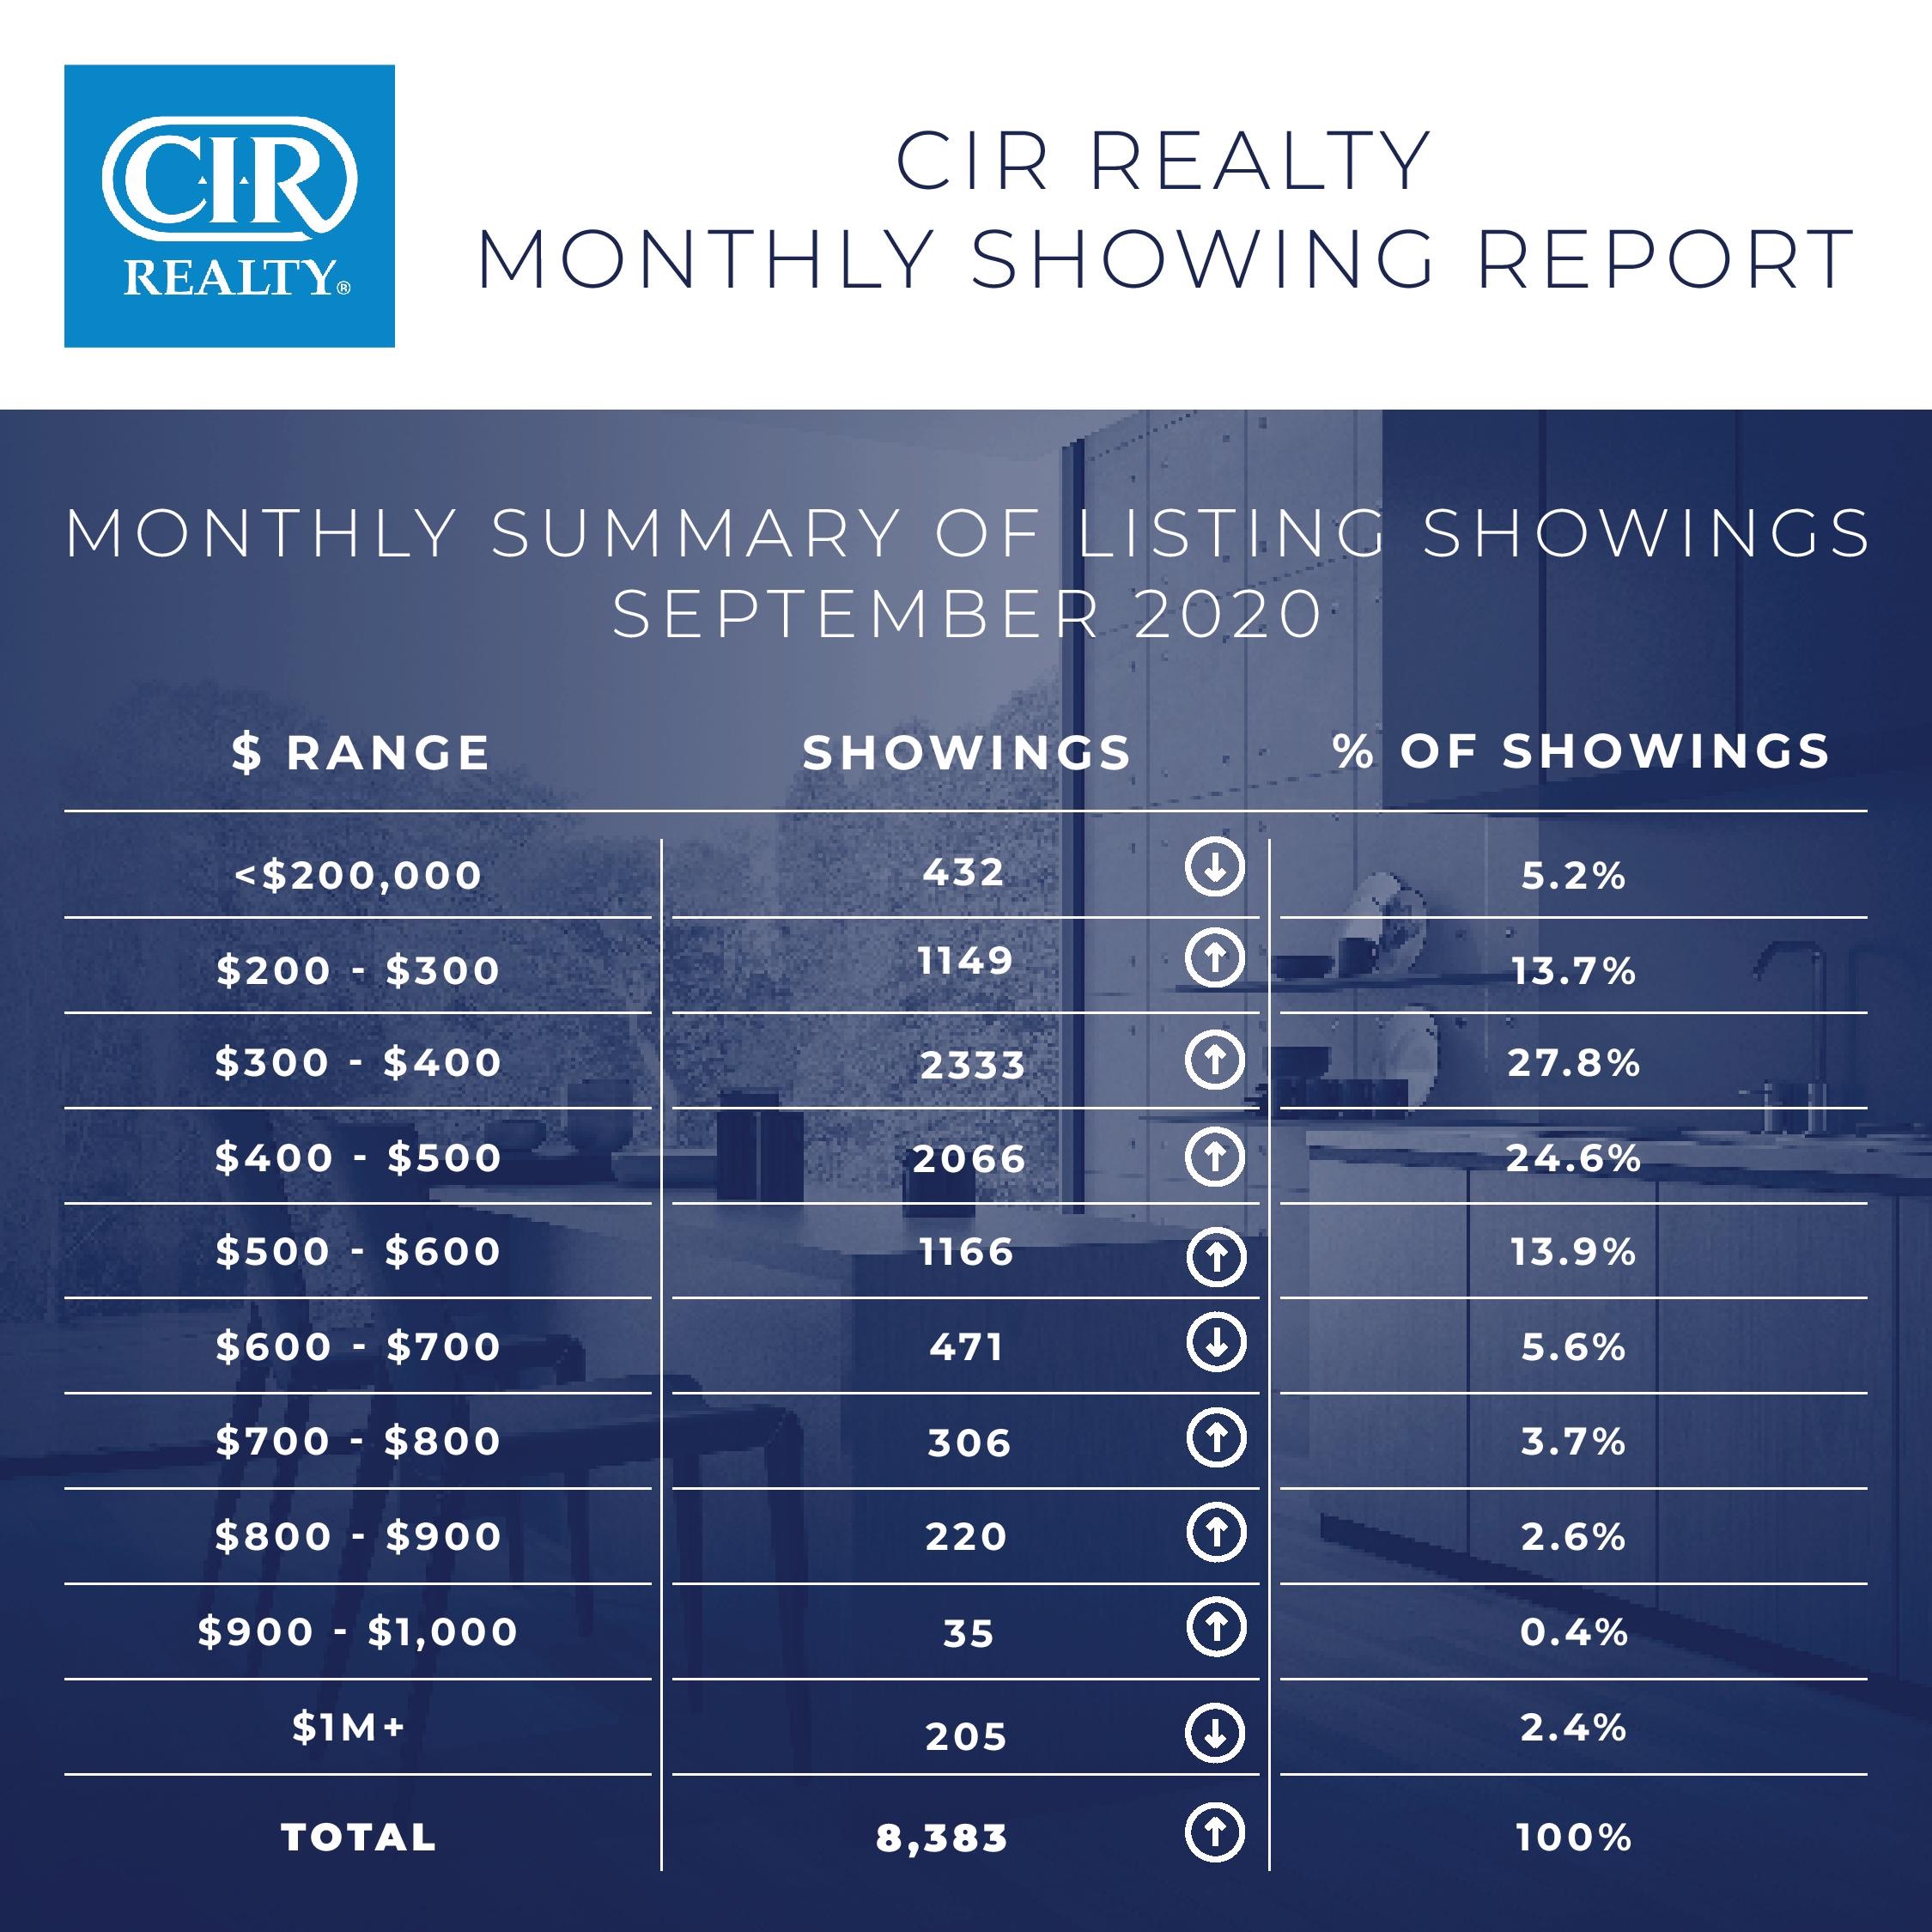
Some quick numbers from the areas that our offices serve:
After a brief pull back in showing and sales activity in August, the Real Estate Markets picked right back up in September with sales across the Province trending above the ten year average.
- CIR's overall showing activity was up 898 showings in September compared to August. Our sales are up over 46% this September compared to last.
- Airdrie's market activity continues to be well above the 10 year average in sales with an increase of 54.9% year over year. With upticks in all price ranges with the exceptions of between $600,000 - $700,000, and $1M +, the activity has been exceptional. With a healthy volume of sales in the lower price points, the property ladder is in full swing. Interestingly enough, it continues to be the Row Housing in the lower price points that has experienced the greatest challenges this year. The heightened sales activity, combined with the inventory lowering for the fourth straight month has brought the months of supply down to 2.32 months. We are now seeing the benchmark price currently sitting at $337,700 compared to $330,600 in January.
- Brooks Real Estate market has slightly improved over August, and edges closer to the ten year average for sales volume. With more inventory coming off of the market, it has helped continue to lower the months of inventory which ended the month at 5.63 months. This remains in buyer market territory, but has helped strengthen the sale to list price ratio from 91.7% in August to 93.3% in September. Pricing remains to be critical in Brooks but the lower months of inventory is a great start to further balancing the market.
- Calgary sales were 24.9% higher year over year compared to last September. There was an uptick in sales in every price range across the board! Even with an uptick of new inventory coming onto the market, the sales were strong enough to offset that which helped lower the months of inventory to 3.66 months. The strengthening market has helped the benchmark price continue to climb back, recovering some of the losses through the Spring. The total residential benchmark price ended the month at $421,700, which is down just 0.2% year over year.
- Canmore's market's busy streak extends to four months in a row! The sales volume continues to be well above the ten year average, with increased activity in all price ranges. Most notably in the $700,000 +++ markets! The increased sales activity has outpaced the new listings coming onto the market which has lowered the monthly inventory to 3.75 months, which in turn has also helped improve the average days on market to 75 and the sales to list price ratio to 97%. The balanced market continues to help the average benchmark price to improve to $774,200 which is only -1.1% year over year.
- Cochrane continues to outperform the 10 year average for total volume of sales, and the new inventory levels continue to drop which has helped the months of supply lower further to 3.07 months. While the lower to mid point in pricing carried the bulk of the sales in August, it has now slowed down and the higher price points over $400,000 have picked up the slack. The lower months of inventory have continued to lower the days on market to 66, and the sales to list price ratio has improved to 97.7%. This has all led to a benchmark price increase year over year by 0.8% ending the month at $409,400.
- Crowsnest Pass, for the second straight month has had a significant jump in sales year over year ending the month 317% higher than September of 2019. September marks the strongest month of the year for the area, which has helped continue to lower the months of inventory to 206 months. This has strengthened many other aspects of the market, but has yet to be reflective in any upward movement in pricing.
- Lethbridge sales activity continues to soar over the numbers this time last year. In September the sales activity was up year over year by 58.6%% and has once again exceeded the ten year average sales volume. The sales activity was up across the board seeing increased activity in all price ranges. With the heightened activity, the months of inventory has once again dropped to 3.5 months. The balanced market has brought with it increases in prices as the average price has risen to $314,063, a 12.1% increase year over year!
- Okotoks sales are up year over year in September by 29.8%, which much of the increase in activity has been in the higher price points while the mid points are similar to last year. The overall months of inventory has dropped even further to 2.41 months which is getting close to becoming a sellers market. This activity has lowered the days on market and increased the sales to list price ratio, which have all led to the benchmark price increasing to $425,000, which is only 0.8% lower year over year.
- Olds Real Estate market has bounced back strong in September after a slower August. The largest amount of activity increase was in the $200,000 - $300,000 price range. The heightened sales activity has exceeded the new listings coming onto the market, and with some inventory coming off of the market it has helped lower the monthly inventory to 3.69 months which is the best it has been all year! We anticipate this to help level off some of the pricing should these trends continue.
- Red Deer's sales have surpassed the ten year average for sales in September, rising 17.8% year over year. The lower to mid priced single family homes continue to be largely responsible for the sales activity, with some modest upticks in the $400,000 - $600,000 price ranges as well. While there was an uptick in new inventory coming onto the market, many listings were also taken off. This combined with the higher sales activity has lowered the months of inventory to 4.32 months which is the best it has been all year.
- Rocky Mountain House had a slight decline year over year in the sales but still ended up close to the ten year average for September. With new inventory continuing to come on, the months of inventory have continued to climb up to 14 months. This supply will lead to softer numbers so pricing in this market remains to be critical to sell a home. Pricing must be compelling enough for a buyer to take action.
- Strathmore/Chestermere - Strathmore's market had a big uptick in sales year over year with September sales rising 86.7% year over year. This was largely due to the market activity in the $300,000 - $500,000 range. Chestermere also saw a big jump with sales rising 54.2% year over year, but that activity was mostly in the $400,000 - $1M range. Both markets remain in the balanced market range with 4.29 and 3.14 months of inventory.
- Sundre sales are slightly down year over year, but are still higher than the ten year average. With less new inventory coming onto the market, the monthly rate has dropped to 6 months which is the best it has been through 2020. Pricing properly is critical in order to compel any buyers in the market to take action.


 Data is supplied by Pillar 9™ MLS® System. Pillar 9™ is the owner of the copyright in its MLS® System. Data is deemed reliable but is not guaranteed accurate by Pillar 9™. The trademarks MLS®, Multiple Listing Service® and the associated logos are owned by The Canadian Real Estate Association (CREA) and identify the quality of services provided by real estate professionals who are members of CREA. Used under license.

 Data is supplied by Pillar 9™ MLS® System. Pillar 9™ is the owner of the copyright in its MLS® System. Data is deemed reliable but is not guaranteed accurate by Pillar 9™. The trademarks MLS®, Multiple Listing Service® and the associated logos are owned by The Canadian Real Estate Association (CREA) and identify the quality of services provided by real estate professionals who are members of CREA. Used under license.
Last Update: September 12, 2026 6:27 AM UT
C
Show More...
Data is supplied by Pillar 9™ MLS® System. Pillar 9™ is the owner of the copyright in its MLS® System. Data is deemed reliable but is not guaranteed accurate by Pillar 9™. The trademarks MLS®, Multiple Listing Service® and the associated logos are owned by The Canadian Real Estate Association (CREA) and identify the quality of services provided by real estate professionals who are members of CREA. Used under license.
Last Update: September 12, 2026 6:27 AM UT
C
Show More...
 Information should be deemed reliable but not guaranteed, all representations are approximate, and individual verification is recommended. Copyright ©2026 All rights reserved.
The trademarks REALTOR®, REALTORS® and the REALTOR® logo are controlled by The Canadian Real Estate Association (CREA) and identify real estate professionals who are members of CREA. The trademarks MLS®, Multiple Listing Service® and the associated logos are owned by CREA and identify the quality of
services provided by real estate professionals who are members of CREA. Used under license.
Show More...
Information should be deemed reliable but not guaranteed, all representations are approximate, and individual verification is recommended. Copyright ©2026 All rights reserved.
The trademarks REALTOR®, REALTORS® and the REALTOR® logo are controlled by The Canadian Real Estate Association (CREA) and identify real estate professionals who are members of CREA. The trademarks MLS®, Multiple Listing Service® and the associated logos are owned by CREA and identify the quality of
services provided by real estate professionals who are members of CREA. Used under license.
Show More...
 Data is supplied by Pillar 9™ MLS® System. Pillar 9™ is the owner of the copyright in its MLS® System. Data is deemed reliable but is not guaranteed accurate by Pillar 9™. The trademarks MLS®, Multiple Listing Service® and the associated logos are owned by The Canadian Real Estate Association (CREA) and identify the quality of services provided by real estate professionals who are members of CREA. Used under license.